TYPES OF SPECTRA & HYDROGEN ATOMIC SPECTRUM
When electromagnetic radiation is passed through a prism or grating it is split up and forms a collection of lines representing different wavelengths. This is called spectrum.
The spectra can be divided into two types viz., emission and absorption spectra. The differences between them are given below.
| Emission Spectrum | Absorption Spectrum |
| 1) The emission spectrum is obtained due to emission of radiation from the substances. | The absorption spectrum is obtained when the substance absorbs the radiation. |
| 2) White lines are formed on the black background. | Black lines are formed on the white background. |
| 3) Formed hen atoms or molecules are de-excited from higher energy level to lower energy level. | Formed when atoms or molecules are excited from lower energy level to higher energy levels. |
The spectra can also be divided into line and band spectra. The differences between them are shown below.
| Line Spectrum | Band Spectrum |
| 1) It consists of sharp and well defined lines. | It consists of closely spaced lines called bands. |
| 2) Characteristic of atoms. | Characteristic of molecules. |
| 3) Formed due to the excitation and de-excitation of electrons in the atoms. | Formed due to the vibrations and rotations of atoms in molecules. |
| 4) It is also known as atomic spectra. | It is also known as molecular spectra. |
HYDROGEN ATOMIC SPECTRUM
When a high potential is applied to hydrogen gas at low pressure in a discharge tube, it starts emitting a bright light. It is separated into several radiations and forms a spectrum upon passing through a prism or grating. The spectrum consists of separate lines corresponding to different wavelengths. This is called Hydrogen atomic spectrum.
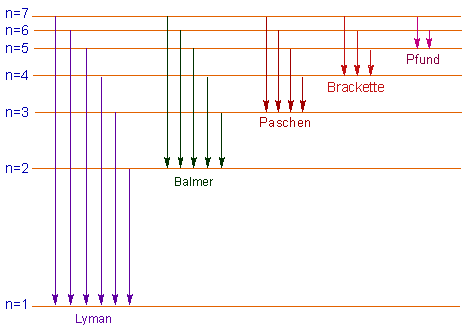
The spectral lines are formed due to electronic transitions from one energy level to another. These lines are divided into five series according to the range of wavelengths as follows.
| Spectral series | Spectral region | n1 | n2 |
| 1. Lyman series | Ultra-violet | 1 | 2,3,4,5,6,7,_ _ _ _ |
| 2. Balmer series | Visible | 2 | 3,4,5,6,7,_ _ _ _ |
| 3. Paschen series | near infra-red | 3 | 4,5,6,7,_ _ _ _ |
| 4. Brackett series | infra-red | 4 | 5,6,7,_ _ _ _ |
| 5. Pfund series | far infra-red | 5 | 6,7,_ _ _ _ |

The wave numbers of spectral lines in each series can be calculated using Rydberg's equation as follows.
![]()
Where
n1and n2 are the principal quantum numbers of orbits corresponding to the electronic transition.
RH = Rydberg's constant = 1,09,677 cm-1
Z = atomic number
Note: Every element has its own characteristic line spectrum. There is regularity in the line spectrum of each element. These spectra can be considered as the finger prints of elements.
Hydrogen has the simplest line spectrum among all the elements. The line spectra become complex with increase in atomic number of the element.